



Bank Efficiency Ratio: What It Is and How to Improve It
Every bank CFO knows the number by heart: the efficiency ratio is the single line that tells the board whether the institution is running lean or bleeding overhead. It measures how many cents a bank spends to earn one dollar of revenue, and it has become the headline metric for operational discipline in a margin-compressed market. What most efficiency-ratio conversations miss is where the number is actually decided — not in the finance department, but in the operational and technology decisions that determine cost-per-loan.

That is exactly where a Building Platform changes the math: instead of accepting the cost structure a vendor hands you, timveroOS lets a bank shape the lending lifecycle at the architectural level and automate the manual work that inflates the numerator.
This guide covers the bank efficiency ratio formula, what counts as a good ratio in 2026, what really drives a high one, and how mid-market banks are lowering it without either the ceiling of SaaS or the cost of an 18-month custom build. There is also an interactive calculator at the end so you can benchmark your own institution in under a minute.
What Is the Bank Efficiency Ratio?
The bank efficiency ratio measures how much a bank spends in operating costs to generate each dollar of revenue. A ratio of 60% means the bank spends 60 cents to produce one dollar of operating income; the remaining 40 cents contributes to pre-provision profit. Because it isolates overhead from revenue, it is one of the clearest read-outs of how well a bank converts activity into earnings (Wall Street Prep, 2024 (opens in new tab)).
Unlike return on assets or net interest margin, the efficiency ratio is a workflow metric. It reflects line-of-business decisions — how a loan is originated, how a servicing exception is handled, how many people touch a file before it funds — far more than it reflects finance-level strategy (Built, 2025 (opens in new tab)). That is why two banks with identical portfolios can post ratios 15 points apart.
The bank efficiency ratio formula
The formula is straightforward:
Efficiency Ratio = Noninterest Expense / (Net Interest Income + Noninterest Income)
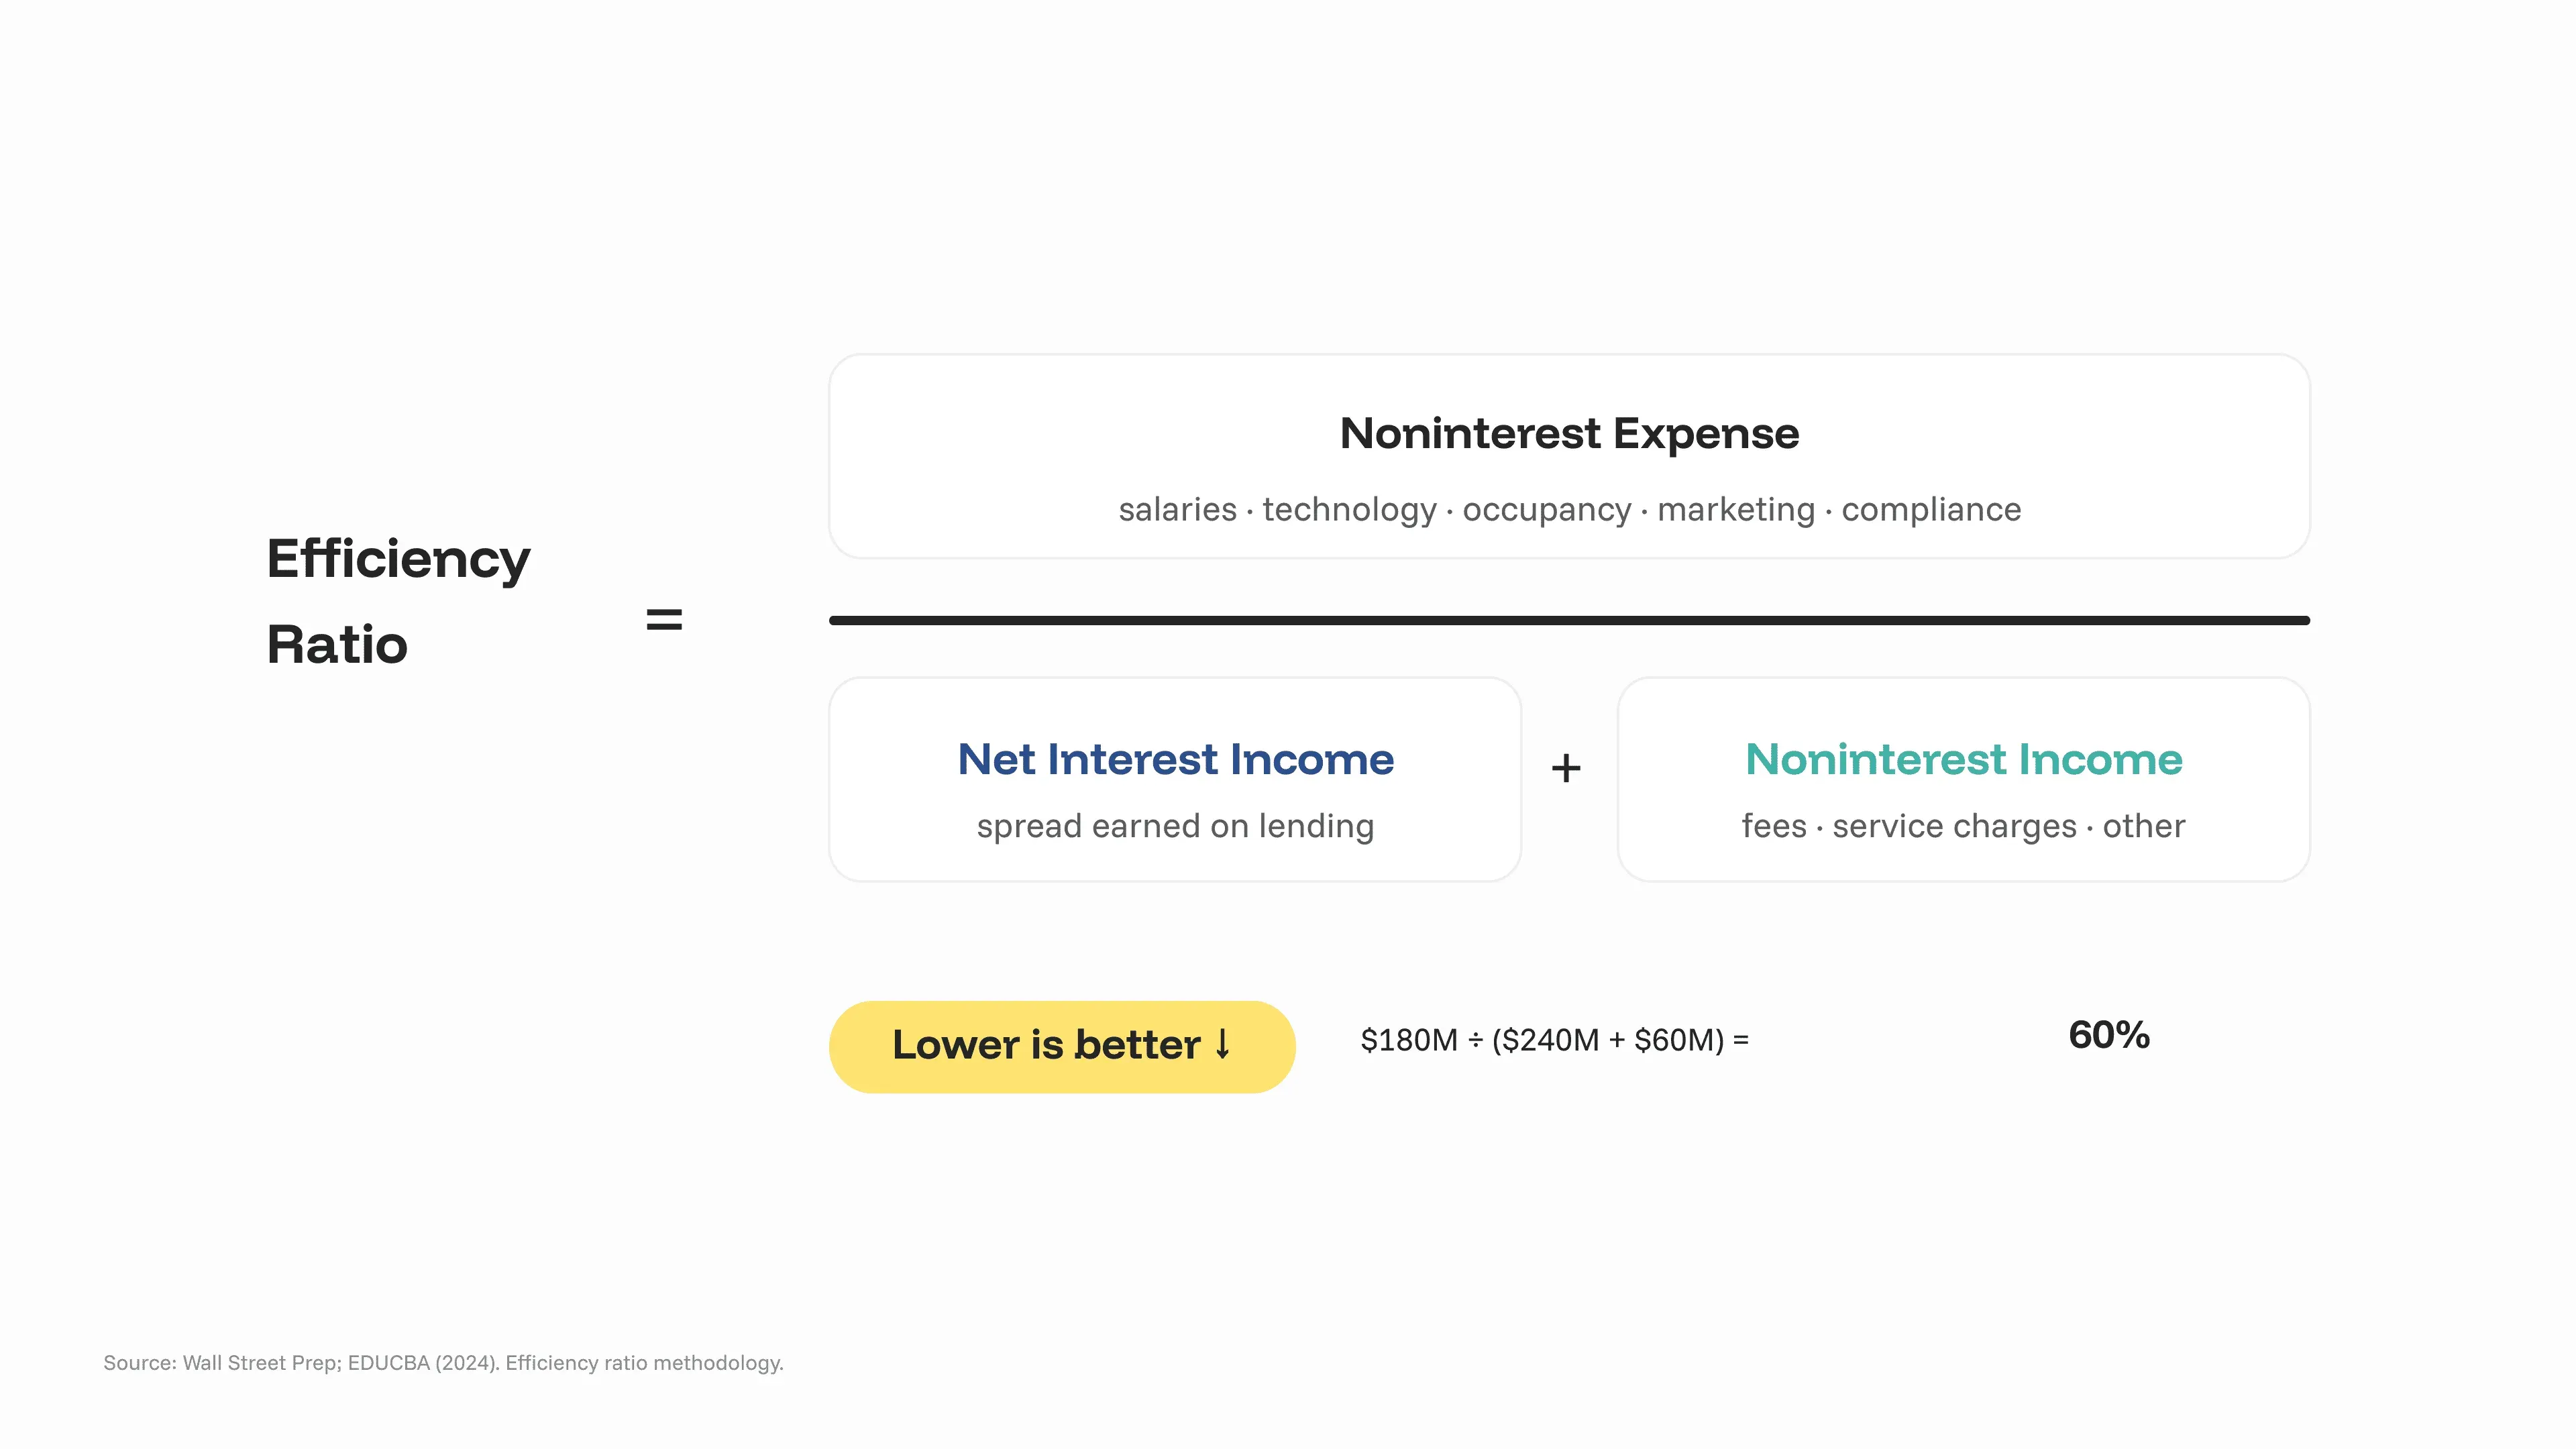
The numerator, noninterest expense, is total overhead: salaries, technology, occupancy, marketing, and compliance — every cost not tied directly to funding loans. The denominator, operating revenue, is the sum of net interest income (the spread earned on lending) and noninterest income (fees, service charges, and other revenue) (EDUCBA, 2024 (opens in new tab)).
A worked example: a bank with $180M in noninterest expense, $240M in net interest income, and $60M in noninterest income has an efficiency ratio of 180 / (240 + 60) = 60%.
Why a lower ratio is better
Because expense sits in the numerator and revenue in the denominator, a lower efficiency ratio is better — it means the bank spends less to earn each revenue dollar. Two levers move it: growing revenue faster than costs, or cutting the cost of producing that revenue. Revenue growth is constrained by rates, competition, and credit appetite. Cost-per-loan, by contrast, is largely an internal engineering problem — which makes it the lever a bank can actually control quarter to quarter.
What Is a Good Bank Efficiency Ratio in 2026?
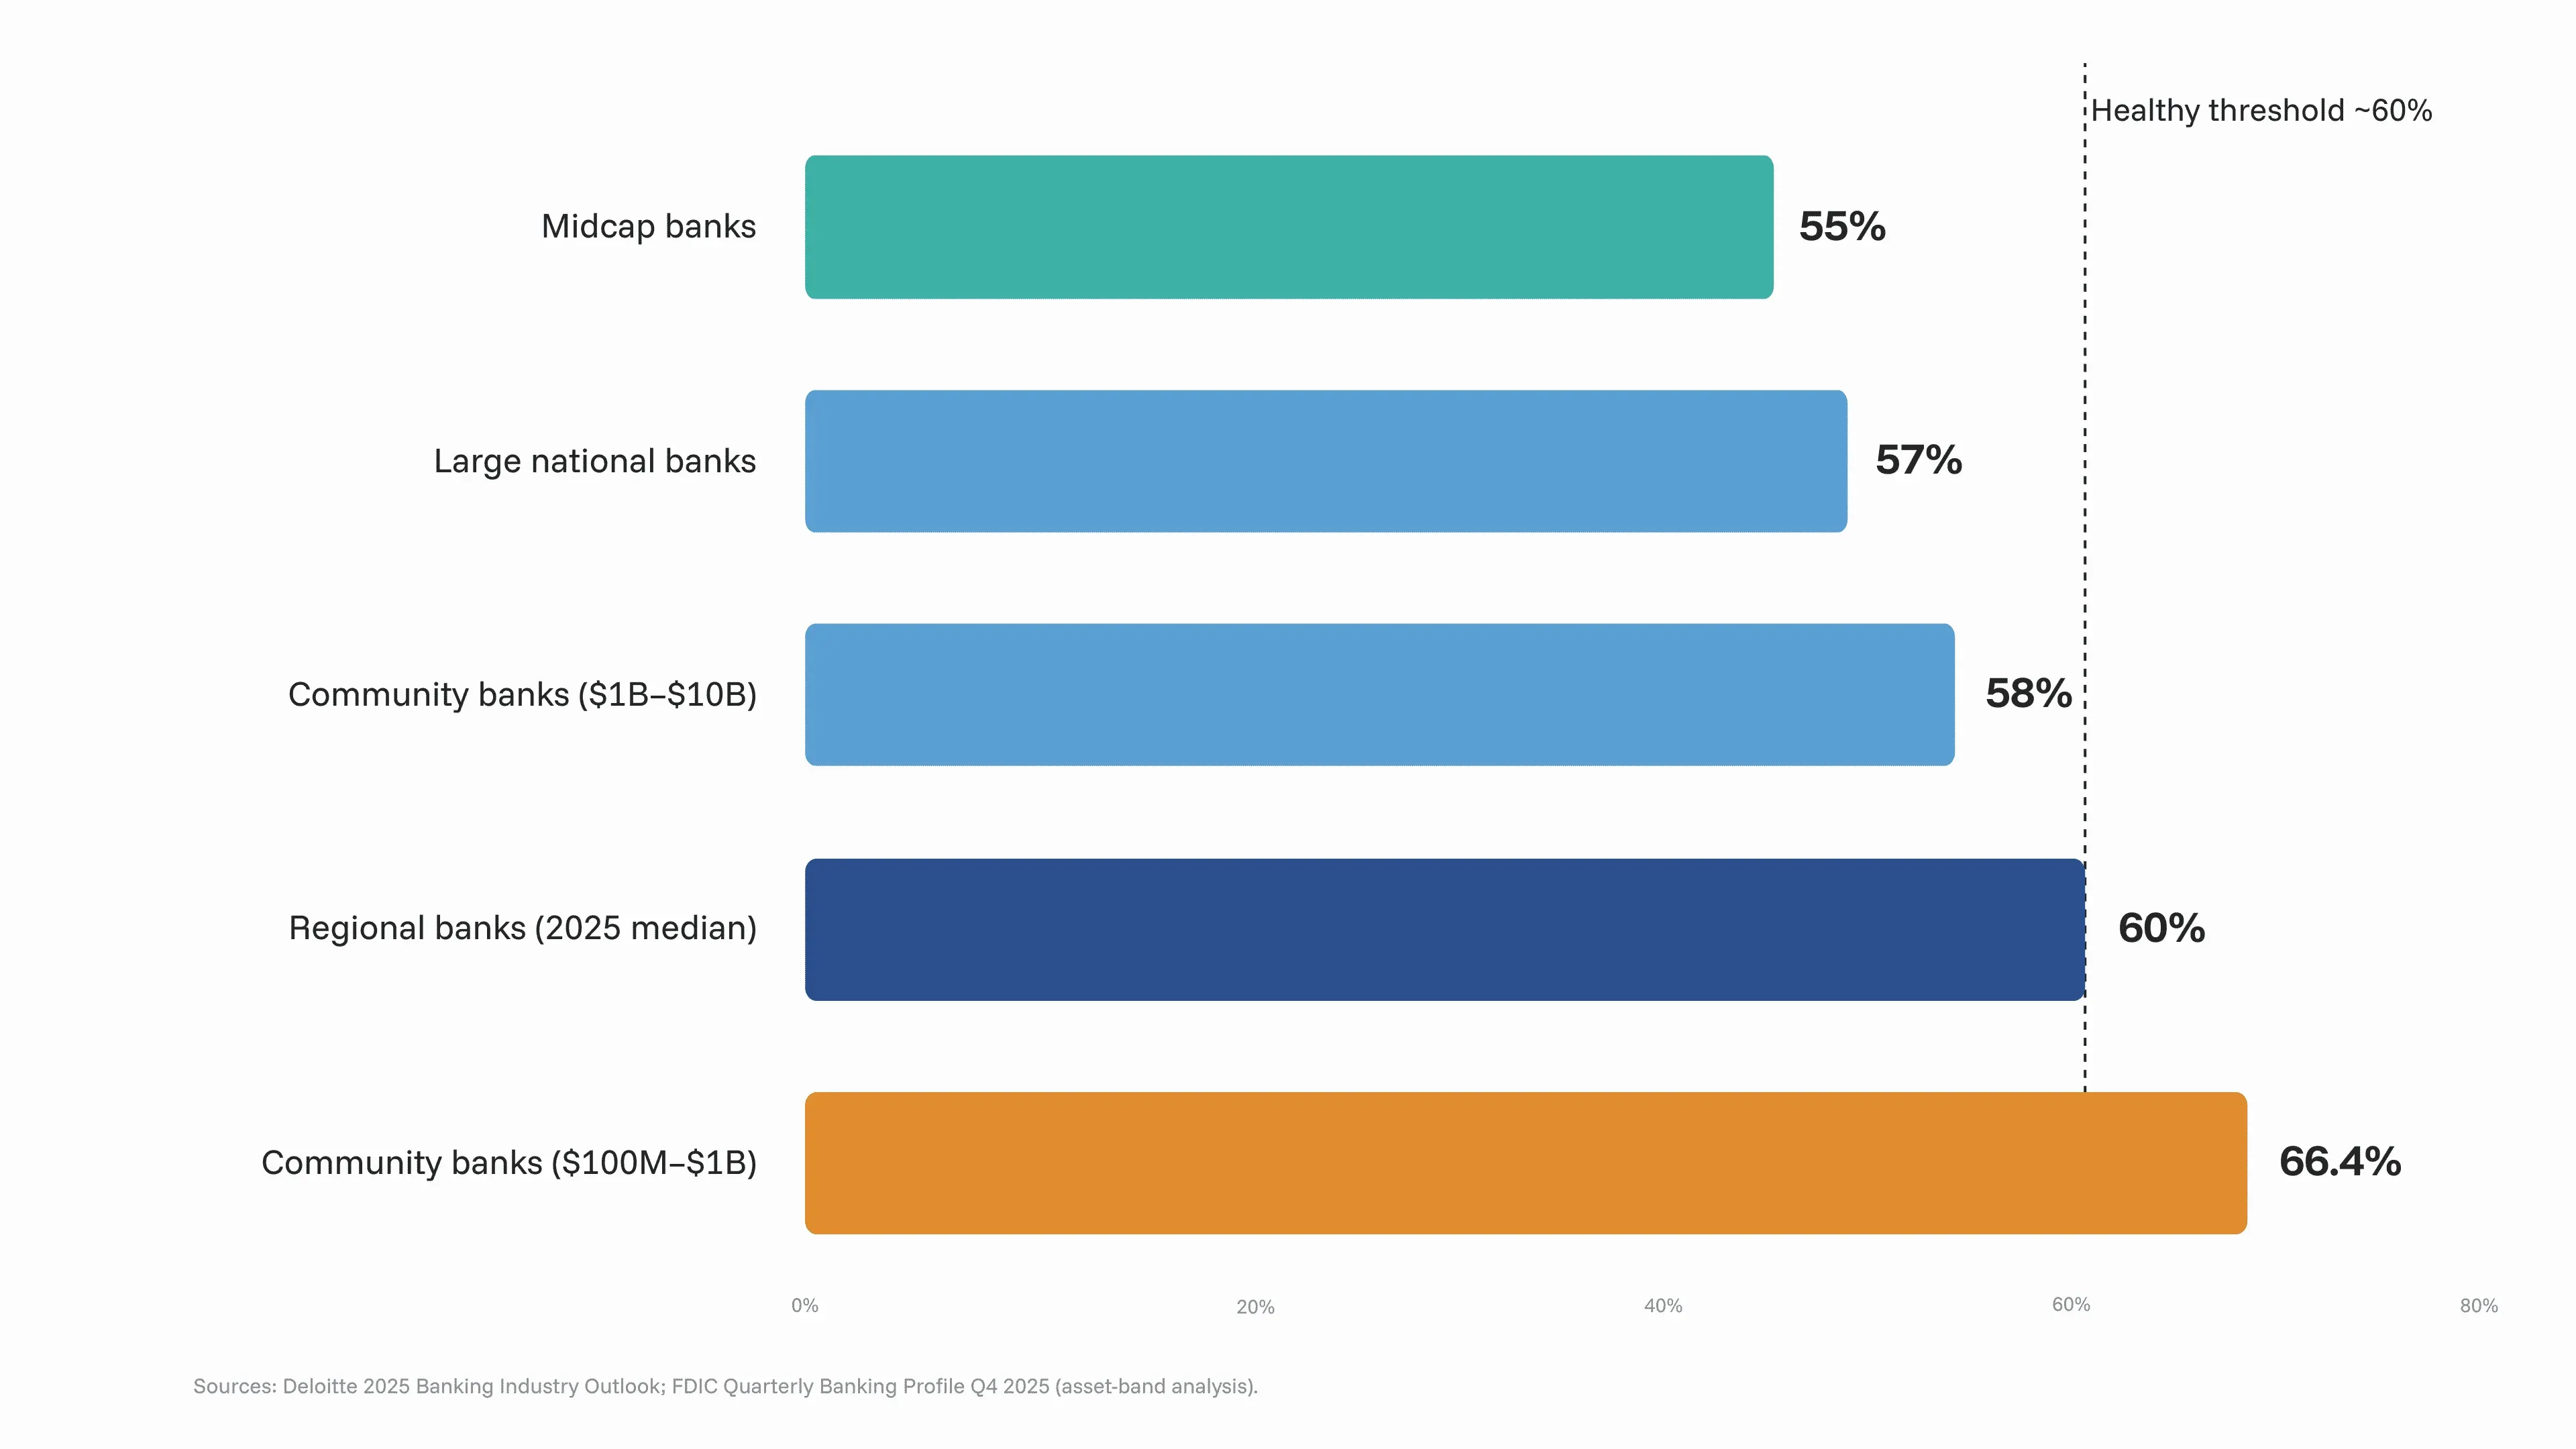
The long-standing rule of thumb is that anything at or below 60% is healthy, and the closer to 50% the stronger the franchise. But the benchmark shifts with bank size, because scale spreads fixed costs across a larger revenue base.
| Bank type | Typical efficiency ratio | Interpretation |
|---|---|---|
| Large national banks | 55–60% | Scale advantage on fixed costs |
| Regional banks | 60–65% | Median hit 60% in 2025 |
| Midcap banks | ~55% (median) | Best-in-class operators |
| Community banks ($100M–$1B) | 65–70% | ~66.4% per FDIC-derived data |
| Community banks ($1B–$10B) | ~58% | Scale benefits begin |
Regional banks posted a median efficiency ratio of 60% in 2025, and Deloitte’s outlook expected the industry average to hover around that mark through the year (Deloitte, 2025 (opens in new tab)). Broken out by asset band, banks in the $100M–$1B range ran roughly 66.4%, while $1B–$10B institutions ran closer to 58% — a scale gap that widens the smaller you go (Visbanking analysis of FDIC QBP Q4 2025 (opens in new tab)).
The direction of travel matters as much as the level. Jefferies analyst David Chiaverini projects roughly 100 basis points of annual efficiency-ratio improvement for regional and midcap banks over the next several years, driven specifically by technology deployment (Built, 2025 (opens in new tab)). In other words, standing still means falling behind: the peer benchmark is a moving target.
Benchmark your own bank. Use the efficiency ratio calculator below to see where you land against these bands and what a 100–300 bps improvement would mean for your pre-provision profit.
What Actually Drives a High Efficiency Ratio
A high efficiency ratio is rarely a headcount problem. It is usually a structural one — and structure is decided by the technology a bank runs on.
Legacy technology and manual operations
The largest hidden contributor to an inflated numerator is legacy technology: maintenance of aging core and lending systems, the workarounds staff build around their limitations, and the manual handoffs those workarounds require (Visbanking, 2025 (opens in new tab)). Deloitte reports that banks modernizing these systems have achieved 40–60% reductions in operating costs and 20–30% gains in operational efficiency (Digital Bank Expert, 2025 (opens in new tab)).
The mechanism is concrete. Automating document intake and routing through a connected platform can cut the labor cost of a single loan action by more than 70%, freeing staff to support portfolio growth without adding headcount (Built, 2025 (opens in new tab)). Every manual step removed from the lending lifecycle comes straight out of the numerator.
Why SaaS and custom builds don’t move the ratio
Banks trying to lower the numerator usually face two unappealing options. The first is a SaaS lending platform: fast to start, but configuration-only. When a bank’s product or compliance requirement falls outside the vendor’s schema, the workflow reverts to manual — and per-loan or per-user fees mean the software cost itself scales with the portfolio, holding the numerator up even as volume grows.
The second is a custom build: full control, but 18–24 months and an engineering team of 8–15 before a single loan is funded (McKinsey, 2024 (opens in new tab)). The sunk cost and execution risk often erase the efficiency gains they were meant to deliver, and technology investments follow a J-curve — costs rise before the 5–10 percentage-point improvement arrives.
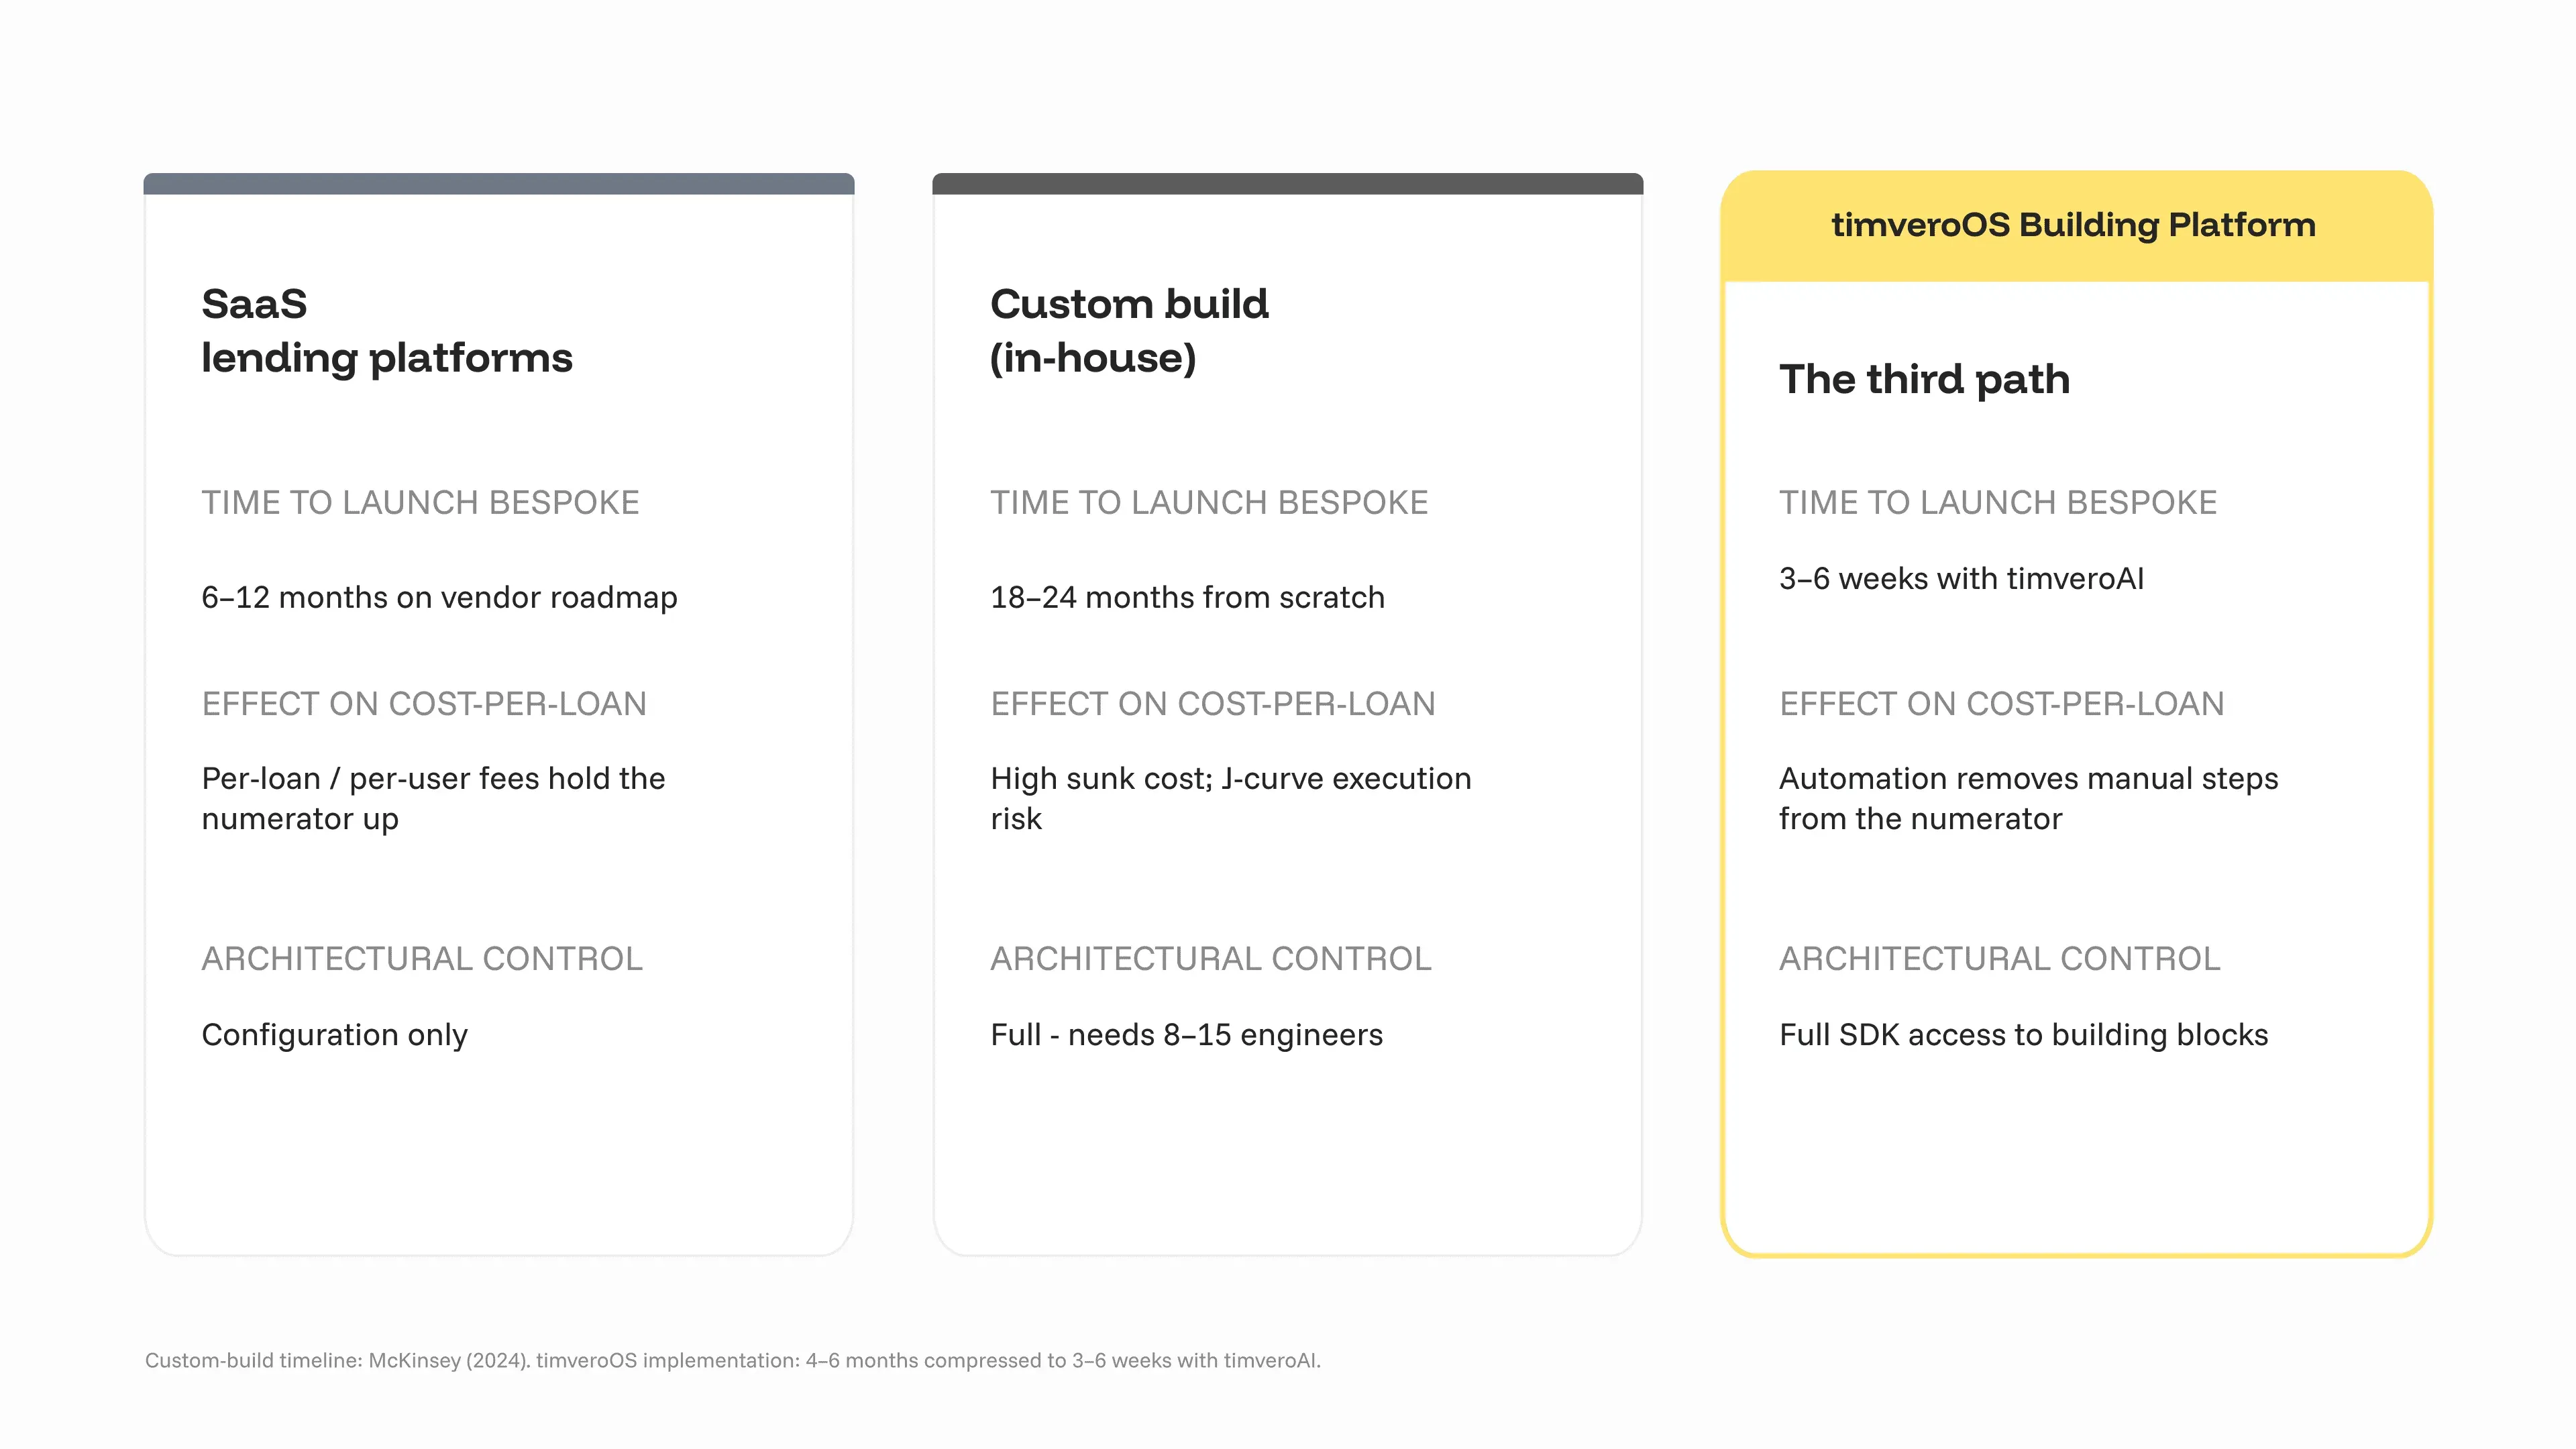
There is a third path. A Building Platform — the foundation beneath timveroOS loan management (opens in new tab) — ships the lending lifecycle as pre-built building blocks (entities, state machines, services, integrations) that a bank configures in the admin panel and extends through the SDK. It behaves like a working system from day one, but the bank retains code-level control over the logic that drives cost-per-loan.
| Criterion | SaaS lending platforms | Custom build (in-house) | timveroOS Building Platform |
|---|---|---|---|
| Time to launch bespoke product | 6–12 months on vendor roadmap | 18–24 months from scratch | 3–6 weeks with timveroAI |
| Effect on cost-per-loan | Per-loan/per-user fees hold the numerator up | Depends entirely on build quality | Automation removes manual steps from the numerator |
| Architectural control | Configuration only | Full | Full (SDK access to building blocks) |
| Deployment | Multi-tenant cloud only | Self-hosted | Self-hosted or private cloud |
| Engineering team required | 1–2 (config) | 8–15 engineers | 1–3 engineers + timveroAI |
| Cost predictability | Scales with portfolio | High variance, sunk cost | Predictable licensing |
How to Improve Your Bank Efficiency Ratio
Improving the ratio sustainably means attacking the numerator where it is largest — the cost of producing and servicing each loan — rather than one-off expense cuts that erode service.
Attack cost-per-loan at the architectural level
Most cost-per-loan lives in the exceptions: the applications that don’t fit the standard flow and get routed to a person. On a SaaS platform those exceptions are permanent, because the workflow logic belongs to the vendor. On a Building Platform, a bank’s own engineers extend the relevant building block directly through the SDK (Java/Spring Boot), turning a recurring manual process into automated logic. This is the difference between renting a workflow and owning it. The same principle applies after funding: on a Building Platform, loan servicing software (opens in new tab) handles collections and restructuring exceptions as configurable logic rather than manual queues, where post-origination cost-per-loan quietly accumulates.
Runtime decisioning is a second lever. The XAI scoring engine — a decisioning building block surfaced through the platform’s advanced loan analytics (opens in new tab) — produces explainable, transparent credit decisions with reason codes, so thin-file and edge-case applications that would otherwise sit in a manual underwriting queue can be decided automatically with human approval where required. Fewer files touched by hand means a lower numerator, without loosening credit governance.
Compress implementation from months to weeks
The efficiency-ratio J-curve is largely an implementation-timeline problem: the longer a project runs before it produces automation, the deeper the cost trough. This is where timveroAI (opens in new tab) matters. It is a RAG-grounded implementation agent — grounded in the platform’s source code, lending ontology, and skeleton library — that composes and configures building blocks under human-in-the-loop approval gates, with changes running in shadow mode before they go live.
timveroAI handles an estimated 70–80% of implementation work and compresses a typical launch from 4–6 months to 3–6 weeks. A shorter path to automation means the efficiency gains land quarters earlier — and the trough of the J-curve is far shallower. timveroAI is strictly an implementation and configuration agent; it does not make credit decisions. That runtime role belongs to the separate XAI scoring engine described above.
“timveroOS has become the core engine behind our law firm lending business. Its framework allowed us to build sophisticated workflows, pricing, and collateral logic per our bespoke structures — something no SaaS or traditional LMS could offer.”
— Noah Cutler, Senior Vice President, Cartiga
Cartiga’s leadership describes the experience in their own words; the word “framework” is their attribution. The point for efficiency-ratio purposes is that owning the workflow logic — rather than waiting on a vendor roadmap — is what let them replace a legacy enterprise platform at 10–12% of its cost.
What the Numbers Look Like in Practice
The efficiency-ratio impact of moving cost-per-loan is not theoretical. AMIO Bank, a Tier 3 regional bank, launched a complex guarantor-lending product on timveroOS in a 4-month MVP — after three failed attempts with two previous vendors — and achieved a 60% reduction in cost-per-loan, 95% process automation, and an 8x improvement in time-to-yes (AMIO Bank case study (opens in new tab)). A 60% cut in the per-loan cost of a growing product line flows directly into a lower numerator.
The pattern repeats across ICPs. Cartiga cut lending costs 90% versus its previous Salesforce build. Finom reached 98% process automation on a proactive SME credit product across five European markets in four months. Across its client base, timveroOS supports $5.5B+ in assets under management across 13+ countries — evidence that the same bank lending platform (opens in new tab) scales from regional-bank volumes upward without re-platforming.
According to Dmitriy Wolkenstein, CEO and co-founder of TIMVERO, the efficiency ratio is ultimately an architecture question: banks that control their lending logic can automate the expensive exceptions, while banks renting configuration keep paying people to fill the gaps their vendor left open.
McKinsey’s Global Banking Annual Review 2025 frames the ceiling on this: AI adoption is expected to drive up to 20% in net cost reductions for banks as it spreads across the industry (CIO Dive, 2025 (opens in new tab)). The banks that capture those savings first — rather than passing them straight to customers — will be the ones that already own the architecture to deploy them.
Calculate Your Bank Efficiency Ratio
The interactive Bank Efficiency Ratio Calculator lets you enter your noninterest expense, net interest income, and noninterest income to get your ratio instantly, see which benchmark band you fall into, and model what a 100–300 bps improvement would add to pre-provision profit. It runs entirely in your browser — no data leaves your device.
Use it to build the internal case: quantify the gap to your peer benchmark, then translate a target ratio into the cost-per-loan reduction required to get there. That reduction is the specification for the automation work — and the starting point for a conversation about a bank lending platform (opens in new tab) that can deliver it.
Frequently Asked Questions
What is a bank efficiency ratio?
The bank efficiency ratio measures how many cents a bank spends in operating costs to earn one dollar of revenue. It is calculated as noninterest expense divided by the sum of net interest income and noninterest income. A lower ratio indicates stronger operating discipline and cost control.
What is a good efficiency ratio for a bank?
A ratio at or below 60% is generally considered healthy, with sub-50% indicating a strong franchise. Benchmarks vary by size: large national banks target 55–60%, regional banks 60–65%, and community banks 65–70%. Regional banks posted a median of 60% in 2025.
How do you calculate the bank efficiency ratio?
Divide noninterest expense by operating revenue, where operating revenue is net interest income plus noninterest income. For example, $180M in expense against $300M in combined revenue produces a 60% ratio. You can compute yours instantly with the calculator above.
Why is a lower efficiency ratio better?
Because expense is the numerator and revenue the denominator, a lower ratio means the bank spends less to earn each revenue dollar, leaving more for pre-provision profit. Banks lower it either by growing revenue faster than costs or by reducing the cost of producing that revenue.
What causes a high bank efficiency ratio?
The largest hidden driver is legacy technology — maintenance of aging systems, workarounds, and the manual handoffs they force. Extensive fixed-cost branch networks, rising compliance demands, and complex products also inflate it. Automating manual lending steps is the most direct way to bring it down.
How can banks improve their efficiency ratio with technology?
By automating the manual exceptions that drive cost-per-loan. Deloitte reports 40–60% operating-cost reductions from core modernization, and automating document intake alone can cut per-loan labor cost by over 70%. Owning the workflow logic — rather than renting vendor configuration — makes those savings durable.
Ready to Move the Numerator, Not Just the Ratio?
Your efficiency ratio is decided by the cost of producing each loan — and that cost is an architecture decision. See how a Building Platform lowers cost-per-loan while keeping your lending logic under your own control.

Head of Marketing
Ivan Halynkin leads Growth & Marketing at TIMVERO, the company behind timveroOS and timveroAI. He works across the seam between product and demand — translating composable lending infrastructure into positioning, content, and demos that resonate with banks, credit unions, and fintechs. His writing focuses on what actually moves the needle for digital lenders: origination economics, AI in credit decisioning, and the trade-offs between SaaS lending boxes and building-platform thinking.
LinkedinLatest News

Agentic AI in Banking: What It Can and Cannot Decide

Launch a Loan Product Fast: What AI Actually Changes

Best AI-Powered Lending Platforms in 2026: A Buyer’s Guide

Lending Software Beyond SaaS vs Build: The Third Path

Embedded Lending for Vertical SaaS: Monetize & Own It

Best Loan Origination Software in 2026: 10 Systems Compared
How U.S. Banks Should Rethink Credit Card Strategy in a Potential 10% APR Cap Environment
Automated Loan Origination: How Lenders Cut Abandonment Rates and Speed Up Approvals

What Is Embedded Lending? How It Works and Why It Matters